
Enteral Nutrition
Assess
Page Contents

Gathering Data for Nutritional Assessment
Before asking the patient questions for your assessment, make sure to introduce yourself and set the agenda for the discussion.
You may review your patient’s chart or obtain information from them directly. You will need to gather information on the following:
- Clinical Data: past medical history, history of presenting illness (HPI), imaging, investigations, pathology, scheduled procedures, consultations, medical orders (medications, infusions), clinical documentation (fluids in and out, bowel movements, drains and tubes, vitals, and documentation of symptoms), medical plan, disposition plan
- Anthropometric Data: weight, height, BMI, weight change, % weight change, % usual body weight, physical assessment, subjective global assessment.
- Nutritional Requirements: energy, protein, and fluid
- Biochemical Data: laboratory values (blood, urine, feces, sputum, tissue, wounds, drains etc.).
- Dietary Data: current/ recent hospital diet order(s), current intake/ recent intake/ baseline intake, dietary restrictions, allergies/ intolerances, eating behaviours and patterns, calorie counts, supplements, previous nutrition/dietitian interventions.
The components reviewed in each section are common considerations but you may need to consider other factors depending on your patient.
Subjective Global Assessment
According to the Canadian Malnutrition Task Force:
Subjective global assessment (SGA) is the gold standard for diagnosing malnutrition. SGA is a simple bedside method used to diagnose malnutrition and identify those who would benefit from nutrition care. The assessment includes taking a history of recent intake, weight change, gastrointestinal symptoms and a clinical evaluation.
Use of the SGA varies among institutions. If you do not use the SGA, you can still follow the procedures for assessment by taking the history described above.
Case Study: Meet Carson

Throughout this section’s case study, you are a Registered Dietitian in General Surgery. The patient you are assessing is a 50 year old male named Carson.
Clinical Data
Clinical data can include, but is not limited to:
- Reason for visit: hospital visit or RD consult.
- Past medical history (PMHx): health history to date.
- History and presenting illness (HPI): symptoms, surgeries, prognosis, tests (i.e. CT scan, ultrasound).
- Current medical orders: IV infusions, medications, consultations.
- Clinical documentation: Fluids intake (i.e. oral, IV, TPN/EN) and output (i.e. urine, vomit, bowel movements, drains (i.e. catheter, chest tube, surgical site drain) and suctioning (i.e. oral secretions, OGT to straight drain), documentation of tubes (i.e. G-tube vs. NGT) and lines (i.e. PICC), vitals.
- Medical care plan and disposition: chemotherapy, radiation therapy, scheduled surgery, transfer to different floor, rehab facility, treatment facility, long term care, home.
Carson’s Clinical Data
Review Carson’s clinical data. If you come across something you are not familiar with, such as a diagnosis or medication, pause and take the time to research it. Understanding all of the components of Carson’s assessment is critical in understanding the case study and is good practice for your practicum. Take note of components that you think may be important for your enteral nutrition plan.
- Age: 50-year-old male
- HPI: 6- month history of progressive dysphagia, loss of appetite, and 25 pounds weight loss
- Admission: 2 weeks ago for worsening dysphagia, poor PO intake, and weakness
- Investigations: CT of neck/abdomen, OGD scope with biopsy
- Pathology: Esophageal cancer (squamous cell carcinoma)
- Operations/ Procedures: partial esophagectomy with primary anastomosis and tumor removal. Gastrostomy tube placed intraoperatively – suspected poor swallowing function post operatively and during the course of chemotherapy and radiation therapy treatment.
- Consultations: Speech Language Pathology (SLP) for videofluoroscopic swallowing study, RD for initiation of EN via G-tube, medical oncology for assessment of chemotherapy and radiation therapy
- Medications via G-tube: Levothyroxine 0.25 mcg @ , Sodium Phosphate 9 mmol × 1 dose, Hydromorphone control release 3 mg 8 hours, Docusate sodium 100 mg BID, Sennosides 17.2 mg @ , Magnesium Hydroxide 30 ml @ HS, Potassium Chloride Liquid 40 mmoL BID × 2 days, PRN dimenhydrinate 25-50 mg q4hrs
- Infusions: IV ⅔ + ⅓ @ 75mL/hr = 1800 mL per day (while )
- Medical plan: chemotherapy + radiation therapy (outpatient)
- Disposition plan: home with home care supports once stable on enteral feeds
Assessments of Swallowing
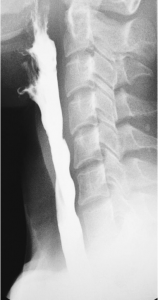
Source: Dr. Ian Bickle via Radiopaedia
Speech-language pathologists (SLP) are concerned with the identification, assessment, treatment, rehabilitation and prevention of communication and/or swallowing disorders.
Videofluoroscopic Swallowing Study (VFSS) is a radiographic procedure that provides a direct, dynamic view of oral, pharyngeal, and upper esophageal function during swallowing. During this procedure, the SLP presents various food and liquid consistencies mixed with barium. The barium is necessary to view structures via videofluoroscopy during the swallow.
The VFSS allows the SLP to assess if food goes into the airway instead of the stomach (aspiration), which part of the swallow is affected, which food and liquid consistencies are safest to swallow, and if certain positions or strategies improve the swallow.
Carson’s VFSS Results
Carson has progressive dysphagia. The VFSS revealed overt aspiration and inability to clear residue from his oral cavity.
The SLP recommends that Carson remain with an alternate form of nutrition (i.e. EN).
Nutrition in Dysphagia Management
Dysphagia is the medical term for swallowing difficulties. For more information about dysphagia and its causes, read this “Dysphagia 101” resource from Nestle Health Science.
The epiglottis muscle is responsible for making sure food or drinks go down your esophagus into the stomach (avoiding the airway). Normally, the airway should close as foods or liquids enter the throat to make sure a swallow is successful. Often, for people with dysphagia, this function can be impaired, leading to food or liquid going into the airway; this is a safety concern for aspiration.
To manage dysphagia, an SLP will complete an assessment and determine the safest dysphagia diet (liquid consistency, food texture, or NPO). Thickened beverages and texture-modified foods may help with swallowing safety by improving control and slowing down the movement of boluses in the mouth and throat. This gives more time to close off the airway so the liquids can travel down the esophagus to the stomach.
The tables below provide an overview of food and drink consistencies for those with ranging degrees of dysphagia, and are based on information from the International Dysphagia Diet Standardisation Initiative (IDDSI).
| Drink Consistencies | Description |
|---|---|
| Thin | Flows like water, fast flow, can drink through any type of cup or straw. |
| Mildly Thick | Nectar-like. Can be eaten with a fork or spoon. Can be scooped and shaped on a plate. Soft and moist with no separate liquid. Small lumps visible within the food which are easy to squash with your tongue. Biting is not required. Minimal chewing is required. |
| Moderately Thick | Honey-like. Can be consumed from a cup. Moderate effort is required to suck through a straw. Can be eaten with a spoon. No oral processing or chewing required. |
| Extremely thick | Puddling-like. Usually eaten with a spoon. Cannot be consumed from a cup because it does not flow easily. Cannot be sucked through a straw. Does not require chewing. |
| Food Consistencies | Description |
|---|---|
| Pureed | Pureed foods are equivalent in terms of consistency to pudding-like or extremely thick liquids. Does not require chewing. Falls off spoon in a single spoonful when tilted and continues to hold shape on a plate. No lumps. Not sticky. Liquid must not separate from solid. |
| Minced & moist | Can be eaten with a fork or spoon. Can be scooped and shaped on a plate. Soft and moist with no separate liquid. Small lumps visible within the food which are easy to squash with your tongue. Biting is not required. Minimal chewing is required. |
| Soft & bite-sized | Can be eaten with a fork, spoon or chopsticks. Can be mashed/broken down with pressure from fork, spoon or chopsticks. A knife is not required to cut this food. Soft, tender and moist throughout but with no separate liquid. Chewing is required before swallowing. |
| Regular | Foods of various textures. Any method may be used to eat these foods. Foods may be hard and crunchy or naturally soft. Includes hard, tough, chewy, fibrous, stringy, dry, crispy, crunchy, or crumbly bits. Includes ‘dual consistency’ or ‘mixed consistency’ foods and liquids. |
Depending on your hospital or clinic, you may encounter IDDSI terminology and standardization. The IDDSI Framework provides common terminology to describe food textures and drink thickness. IDDSI tests are intended to confirm the flow or textural characteristics of a product at the time of testing.
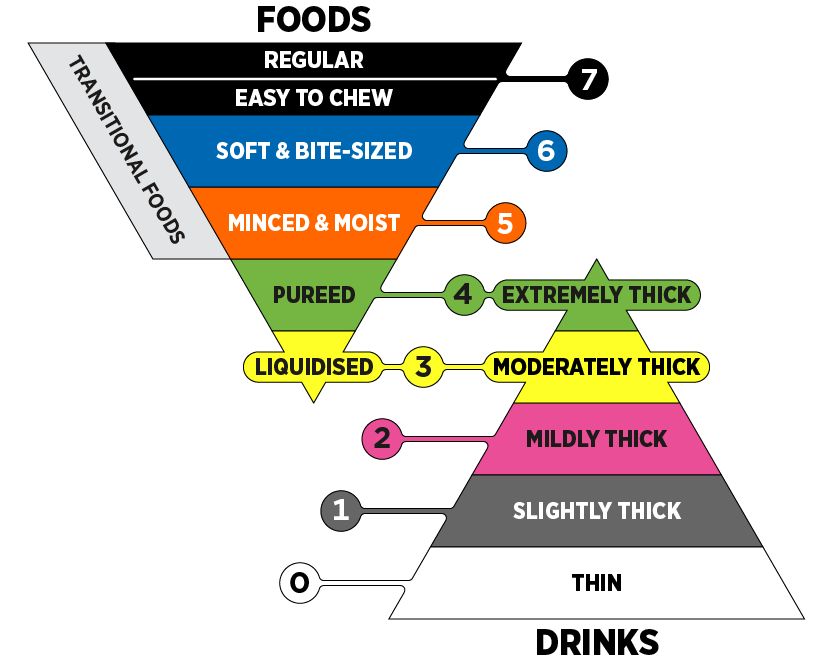
Source: © The International Dysphagia Diet Standardisation Initiative 2019. Licensed under CC-BY-SA 4.0. Derivative works extending beyond language translation are not permitted.
Anthropometric Data
Assessment of Body Weight
Body weight is the most used indicator of nutritional status, as it is used for calculating fluid, protein, and energy requirements.
Obtaining height and age is often necessary to further interpret body weight. Body Mass Index (BMI) is commonly used as a classification to evaluate health risk, as demonstrated in the table below. Master’s tables are used for adults aged 65+.
It is important to consider if the weight you are using needs to be adjusted for fluid retention or if the patient has an amputation. For the most accurate estimations, using a weight as close to a “dry weight” is best.
| Classification | BMI Category (kg/m2) | Risk of Developing Health Problems |
|---|---|---|
| Underweight | <18.5 | Increased |
| Normal weight | 18.5-24.9 | Least |
| Overweight | 25.0-29.9 | Increased |
| Obese class I | 30.0-34.9 | High |
| Obese class II | 35.0-39.9 | Very high |
| Obese class III | >40.0 | Extremely high |
It is also important to use other markers of weight, including % weight change and % usual body weight during your assessment to further evaluate your patient’s weight. The calculations in the tables below will help you interpret the findings in regard to severity and indication of malnutrition.
| Time Frame | Significant Weight Loss (%) | Severe Weight Loss (%) |
|---|---|---|
| 1 week | 1-2 | > 2 |
| 1 month | 5 | > 5 |
| 3 months | 7.5 | > 7.5 |
| 6 months | 10 | > 10 |
| Unlimited time | 10-20 | > 20 |
| UBW range (%) | Interpretation |
|---|---|
| 85 – 95 | May indicate mild malnutrition |
| 75 – 84 | May indicate moderate malnutrition |
| < 74 | May indicate severe malnutrition |
Carson’s Anthropometric Data: Body Weight
- Height: 6’1″ (1.85 m)
- Current weight: 130 lbs (59 kg)
- Current BMI: 59 kg ÷ 1.85 m2 = 17.2 kg/m2
- Usual weight: 155 lbs (70.4 kg)
- Timeframe of weight loss: 6 months
- % weight loss: ([70.4 kg − 59 kg] ÷ 70.4 kg) × 100 =16.2%
- % UBW: (59 kg ÷ 70.4 kg) × 100 = 83.8%
Physical Assessment
SGA Guidance
Another important assessment strategy is to physically evaluate your patient. It is important to go into your patient’s room to evaluate physical signs and symptoms of malnutrition. The SGA provides guidance on how to complete a physical examination by using a head to toe method for the assessment of muscle wasting, subcutaneous fat, and fluid retention.
| Physical Examination | Normal | Moderate | Severe |
|---|---|---|---|
| Temple | Well-defined muscle | Slight depression | Hollowing, depression |
| Clavicle | Not visible in males, may be visible but not prominent in females | Some protrusion; may not be all the way along | Protruding/prominent bone |
| Shoulder | Rounded | No square look, process may protrude slightly | Square look, bone prominent |
| Scapula/ribs | Bones not prominent | Mild depression or bone may show slightly | Bone prominent, significant depressions |
| Quadriceps | Well defined | Depression/ atrophy medially | Prominent knee, severe depression medially |
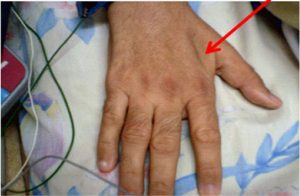
| Interosseous muscle between thumb and forefinger (back of hand)** | Muscle protrudes, could be flat in females | Slightly depressed | Flat or depressed area |
| Physical Examination | Normal | Moderate | Severe |
|---|---|---|---|
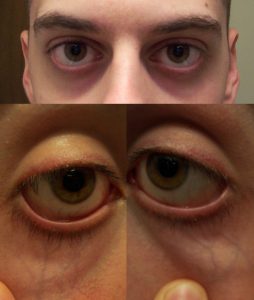
| Under the eyes | Slightly bulging area. | Somewhat hollow look, slightly dark circles. | Hollowed look, depression, dark circles. |
| Triceps | Large space between fingers. | Some depth to fat tissues, but not ample. Loose fitting skin. | Very little space between fingers or finger touch. |
| Ribs, lower back, sides of trunk | Chest is full, ribs do not show. Slight to no protrusion of the . | Ribs obvious, but indentations are not marked. Iliac crest somewhat prominent. | Indentation between ribs obvious. Iliac crest very prominent. |
| Physical Examination | Normal | Moderate | Severe |
|---|---|---|---|
| Edema | None | Pitting edema of extremities / pitting to the knees, possible edema if bedridden | Pitting beyond knees, sacral edema if bedridden, may also have generalized edema |
| Ascites | Absent | Present (may only be present on imaging) | Present (may only be present on imaging) |
Other Physical Signs & Symptoms
There are other physical signs and symptoms of nutritional deficiencies. This table provides a general overview of the sites of the body to consider, the physical examination, and the potential nutritional deficiencies or metabolic status associated with the assessment.
| Site | Physical Examination | Potential Nutritional/ Metabolic Status |
|---|---|---|
| Skin Integrity |
|
|
| Face | Moon face or bilateral temporal wasting | Protein- calorie malnutrition |
| Mouth | Dry, cracked, red lips | Riboflavin, niacin, B12 deficiency |
| Abdomen | Rounded, distended | Gas, edema, ascites, obesity |
| Temperature | Increased temperature | Increased energy and fluid requirements |
| Respiration | Increased respiratory rate | Altered calorie and protein requirements
Energy needs may be increased if weaning from ventilator or decreased if chronically ventilator dependent |
Carson’s Anthropometric Data: Physical Assessment
- Mild-moderate bilateral temporal wasting, adipose and lean body mass (LBM) tissue loss (triceps, temporalis, and interosseous)
- Physical signs of mild-moderate muscle wasting (in context of BMI and severe % weight loss values – patient appears underweight)
- Reports fatigue and weakness, with minimal exertion
- Can ambulate, but walks infrequently
- No edema or abdominal distension
- Temperature and respiratory rate normal
Carson’s physical assessment data appears to validate the anthropometric data and calculations we previously completed, such as his BMI suggesting he is underweight and his weight change suggesting severe weight loss.
Nutritional Requirements
Energy Requirements
Predictive equations are for estimation purposes only. The most accurate data will provide the most accurate estimation, but without indirect calorimetry this is the best we can achieve. As a result, there is a need for frequent re-assessment of energy requirements.
Factors affecting the accuracy of estimated requirements include:
- Acute or chronic respiratory distress syndrome
- Large open wounds or burns
- Malnutrition with altered body composition
- Underweight, obesity, limb amputation, peripheral edema, ascites
- Multiple or neurological trauma
- Multisystem organ failure
- Postoperative organ transplantation
- Sepsis
- Systemic inflammatory response syndrome
- Paralytic or barbituate agents
Predictive Equations
Here are three commonly used predictive equations. There are other predictive equations you may use, depending on your area of practice. Accuracy varies by equation and population. Experience is helpful for an accurate selection and utilization of these predictive equations.
Abbreviations:
- EER = estimated energy requirements
- REE = resting energy expenditure (kcal)
- A = age (years)
- PA = physical activity
- W = weight (kilograms)
- H = height (centimetres, unless otherwise specified)
- H* = height (metres)
- Dietary Reference Intakes (DRI)
- EER: age, physical activity, weight, height
- Males: EER (kcal) = 662 − 9.53A + PA × (15.91W + 549.6H*)
- Females: EER (kcal) = 354 − 6.91A + PA × (9.36W + 726H*)
- Harris Benedict (HB)
- REE: weight, height, age
- Males: REE (kcal) = 66.5 + 13.75W + 5.0H − 6.78A
- Females: REE (kcal) = 655.1 + 9.56W + 1.85H − 4.68A
- Mifflin-St.Jeor (MSJ)
- REE: weight, height, age
- Males: REE (kcal) = 9.99W + 6.25H − 4.92A + 5
- Females: REE (kcal) = 9.99W + 6.25H − 4.92A − 161
- Estimated Calories/kg
Activity Factors
Most predictive equations evaluate resting energy expenditure (REE), meaning you need to consider physical activity energy expenditure in addition to the original calculation. The activity factor (AF) is applied to the REE value. Activity factors are not to be used with DRI equations.
| Activity Level | AF |
|---|---|
| *Resting (lying or sitting) | 1.0 – 1.4 |
| Lying still, sedated or asleep | 0.9 – 1.1 |
| Lying still, conscious | 1.0 – 1.1 |
| Spinal cord injury, 0-4 weeks post-injury | 1.1 |
| Bedrest (moving self around bed) | 1.15 – 1.2 |
| Mobilizing occasional on ward | 1.15 – 1.4 |
| *Sedentary/ Light Activity (standing for long periods) | 1.4 – 1.6 |
| Mobilizing frequently on ward | 1.4 – 1.5 |
| Regular, intensive physiotherapy | 1.5 – 1.6 |
| *Moderate Activity (continuous movement/slow walking) | 1.6 – 1.8 |
Stress Factors
Most predictive equations evaluate resting energy expenditure (REE), meaning you may need to consider energy expenditure from stress. The stress factor is applied to the REE value.
| Clinical Status | SF |
|---|---|
| Cancer | 0.8 – 1.5 |
| Elective surgery | 1.0 – 1.1 |
| Peritonitis | 1.05 – 1.25 |
| Multiple/ long bone fractures | 1.1 – 1.3 |
| Fever | 1.2 per 1°C > 37°C |
| Spinal cord injury, 0-4 weeks post-injury | 1.2 |
| Sepsis | 1.2 – 1.4 |
| Severe infection | 1.2 – 1.6 |
| Burns | 1.2 – 2.0 |
| Infection with trauma | 1.3 – 1.55 |
| Multiple trauma, traumatic brain injury | 1.4 |
Protein Requirements
This table represents general guidelines for protein requirements according to how hypermetabolic your patient is. Consider your individualized patient to determine the most accurate protein requirement. Experience using these methods is helpful. You can consider calculating requirements using various methods and compare values.
| Patient Category | Protein (g/kg) |
|---|---|
Not hypermetabolic:
|
0.8 – 1.5
(1.0 – 1.5 for |
Moderately hypermetabolic, including:
|
1.2 – 1.5 |
| Hypermetabolic, including multi-trauma |
1.5 – 2.0
|
The following table represents a more detailed overview of protein requirements specific to various clinical conditions. This may be more useful for you during practice than the general guidelines, if your patient’s clinical status is reflected in this table.
| Clinical Status | Protein (g/kg) |
|---|---|
| Normal (non-stressed, non-depleted) | 0.8 – 1.0 |
| Postoperative | 1.0 – 1.5 |
| Sepsis | 1.5 – 2.0 |
| Multiple trauma | 1.3 – 1.7 |
| Traumatic brain injury | 1.2 – 2.0 |
| Burns | 1.2 – 2.0 |
| Catabolism | 1.2 – 2.0 |
| Refeeding syndrome | 1.2 – 1.5 |
| Cancer | 0.8 – 2.0 |
| Hemodialysis | 1.1 – 1.2 |
| CCPD/CAPD | 1.2 – 1.3 |
| CRRT | 1.5 – 2.0 |
| Acute Renal Failure | 1.0 – 1.5 |
| Chronic Kidney Disease | 0.8 – 1.0 |
| Mild-Moderate Stress | 1.2 – 1.3 |
| Moderate-Severe Stress | 1.5 – 2.0 |
| Severe + Wound Healing | 1.5 – 2.0 |
| HIV (asymptomatic) | 1.0 – 1.4 |
| HIV (symptomatic) | 1.5 – 2.0 |
| HIV (CD4 < 200/AIDS defining condition) | 2.0 – 2.5 |
Fluid Requirements
This table represents general guidelines for calculating fluid requirements. Consider your individual patient prior to determining the best method to use. Experience using these methods is helpful. You can calculate requirements using various methods and compare values.
| Based Upon | Method of Fluid Estimation |
|---|---|
| Weight |
|
| Energy | 1 mL per kcal |
| Age and weight |
|
| Fluid balance | Urine output + 500 mL/day |
Carson’s Nutritional Requirements
Review Carson’s energy, protein, and fluid requirements.
For Carson’s energy requirements, we selected the Harris Benedict equation. However, when new to practice, or new to a clinical area, it may be helpful to calculate a patient’s energy requirement using more than one equation and comparing the values.
66.5 + 13.75 (59) + 5.0 (185.4) − 6.78 (50) = 1466 (REE) × 1.15 (AF − mobilizing infrequently) × 1.0 (SF − elective surgery and cancer) = 1686 kcal/day
Regarding activity factors, these are frequently overestimated. An AF of 1.15 is appropriate for a patient who is mobilizing occasionally around the ward. Carson is fatigued, weak, deconditioned, and is likely not getting up and walking around. He may even be a fall risk and require staff supervision, which makes it even less likely that he will ambulate. If he was a “real” patient, you could liaise with the physiotherapist or nurse to assess his mobility and determine his AF.
Regarding his stress factor, it would be appropriate to use 1.0 because of Carson’s recent surgery and cancer diagnosis. The plan is for Carson to start radiation therapy and chemotherapy, therefore his SF may increase with the onset of treatment. Carson’s SF will need to be re-evaluated over time.
In this case, as Carson is malnourished, it would be reasonable to select the higher end of his caloric estimation.
Carson’s energy Requirements: ~1770 kcal/day (30 kcal/kg)
For Carson’s protein requirements, it is appropriate to use the detailed chart to select a range because he is post-operative and has a cancer diagnosis. The chart suggests a wide range of 1.0-1.5g/kg/day. Due to the type of cancer and the surgery he had, an appropriate range would be 1.2-1.3 g/kg/day to start. Carson has evidence of malnutrition and muscle wasting, so it is likely that these requirements will need to be reassessed.
Carson’s protein requirements: 71-77 g/day (1.2-1.3 g/kg/day)
Fluid requirement calculation: 35 mL/kg (for ages 20-55) × 59kg = 2065 mL/day
Carson’s fluid requirements: 2065 mL/day (35 mL/kg)
Biochemical Data
Laboratory Values
| Laboratory Value | Normal Range |
|---|---|
| WBC | 4.00 –11.00 E9/L |
| Glucose (Random) | 4.0 – 7.8 mmol/L |
| Sodium (Na+) | 135 – 145 mmol/L |
| Potassium (K+) | 3.5 – 5.0 mmol/L |
| Chloride (Cl-) | 96 – 106 mmol/L |
| Phosphorus (PO4) | 0.8 – 1.35 mmol/L |
| Calcium (Ca2+) | 2.1 – 2.1 mmol/L |
| Magnesium (Mg2+) | 0.63 – 0.94 mmol/L |
| Albumin (Alb) | 35 – 50 g/L |
| Blood Urea Nitrogen (BUN) | 3.0 – 7.0 mmol/L |
| Creatinine (Cr) | 44 – 80 μmol/L |
Carson’s Biochemical Data: Lab Values
Review Carson’s lab values in the table below. The “Notes” column indicates which values are outside of target range and explains how to correct calcium and magnesium when albumin values are <35g/L.
| Laboratory Value | Carson’s Value | Notes |
|---|---|---|
| Sodium (Na+) | 138 mmol/L | N/A |
| Potassium (K+) | *3.3 mmol/L | Outside the target range |
| Chloride (CL-) | 96 mmol/L | N/A |
| Phosphorus (PO4) | *0.7 mmol/L | Outside the target range |
| Calcium (Ca+2) | *2.0 mmol/L corrected = 2.28mmol/L |
Outside the target range
Correct when albumin is <35 g/L Corrected calcium = Calcium calculation for Carson: |
| Magnesium (Mg+2) | *0.60 mmol/L corrected = 0.67mmol/L |
Outside the target range
Correct when albumin is <35 g/L Corrected magnesium = Calcium calculation for Carson: |
| Albumin (Alb) | *26 g/L | Outside the target range
Albumin is <35g/L, requiring corrections for calcium and magnesium. |
| Blood Urea Nitrogen (BUN) | *2.8 mmol/L | Outside the target range |
| Creatinine (Cr) | 60 μmol/L | N/A |
IV Solutions
Here is an overview of common IV solutions used in hospital. It is important to review which IV solution(s) your patient is receiving as it could be providing a patient with energy/ dextrose. Different IV solutions are also chosen in various clinical scenarios. This needs to be considered when you are creating a nutrition care plan.
| Solution | Kcal/L | Composition/L |
|---|---|---|
| Normal Saline (0.9% NaCl) | 0 | Na – 154 mmol
Cl – 154 mmol |
| ½ Normal Saline (0.45% NaCl) | 0 | Na -77 mmol
Cl – 77 mmol |
| D5W (5% Dextrose) | 170 | Dextrose – 50 g |
| D10W (10% Dextrose) | 340 | Dextrose – 100 g |
| 5% Dextrose and 0.9% NaCl | 170 | Dextrose – 50 g
Na – 154 mmol Cl – 154 mmol |
| 2/3 and 1/3 (3.3% Dextrose and 0.3% NaCl) | 112 | Dextrose – 33 g
Na – 51 mmol Cl – 51 mmol |
| Ringer’s Lactate | 9 | Na – 130 mmol
K – 4 mmol Ca2+ – 1.4 mmol Cl – 109 mmol Lactate – 28 mmol |
Carson’s Biochemical Data: IV Solution
Carson is currently receiving IV ⅔ + ⅓ @ 75mL/hr = 1800 mL/day (1.8L) for hydration while NPO:
- 1 L of this solution = 112 kcal, 33 g of dextrose
- 112 kcal × 1.8 L = 202 kcal/day
- 33 g × 1.8 L = 59 g of dextrose/day
Carson is at risk of refeeding syndrome, therefore we need to consider the amount of dextrose he is receiving from his IV solution. We will take this into consideration when calculating his starting rate and advancing his feeds towards goal rate to prevent overfeeding energy and carbohydrates.
This IV solution and rate was ordered while Carson was NPO, it may not be required now that he is starting on enteral feeds. He has no IV medications that require ongoing infusion.
Liaise with the team to:
- Decrease his IV rate with initiation of feeds; or,
- Change the IV solution to 0.9% NaCl; or,
- Saline lock the IV and provide free water flushes via G-tube.
Dietary Data
Obtaining accurate dietary data can vary based on your patient (e.g. family members present, patient’s cognitive ability, flow sheets or calorie counts, etc.), as well as the setting (e.g. inpatient compared to outpatient).
If possible, collect the following information:
- Diet order(s): Important for a representation of daily intake while in the hospital (can include enteral nutrition & supplements).
- Dietary recall: 24 hr recall (if recent admission or representation of food consumption in hospital), common eating patterns, or short-term and long-term representation of eating patterns or typical foods.
- Calorie counts: Depending on the patient, you may order calorie counts to monitor/determine how much/ what they are eating in hospital.
Carson’s Dietary Data
Over the past 6 months, Carson’s diet consists of mostly fluids due to progressive dysphagia and loss of appetite.
Over the past 2 weeks (prior to hospital admission), Carson was not eating or drinking much due to feeling unwell and having no appetite. Estimated caloric intake ~500 kcal per day.
Carson’s dietary intake includes:
- Soups, broths, tea
- Applesauce
- Pudding or yogurt
- Soft drinks
- Tomato juice
Refeeding Syndrome
Refeeding syndrome is a concern for any patient who has been without consistent or adequate nutrition for a prolonged period. It is a series of metabolic events that occur as a result of reinstitution of nutrition (carbohydrates) to patients who are starved or severely malnourished. Refeeding syndrome is characterized by low potassium, magnesium, and phosphate with/or without fluid retention.
Serious complications can be avoided by:
- Thorough nutritional assessment
- Appropriate identification of patients at risk
- Slow initiation of feeding
- Careful monitoring
The table below outlines complications of refeeding syndrome.
| Hypophosphatemia | Hypokalemia | Hypomagnesemia | |
|---|---|---|---|
| Cardiac | Arrhythmia, CHF, cardiomyopathy, decreased blood pressure | Arrhythmia, cardiac arrest, EKG changes | Arrhythmia, increased heart hate |
| Neurological | Altered mental status, paralysis, seizures | Weakness, paralysis, lethargy/ confusion | Altered LOC, weakness, seizures, tremors |
| Respiratory | Respiratory failure, ventilator dependence | N/A | N/A |
| Skeletal | Rhabdomyolysis, weakness | N/A | N/A |
| Metabolomic | N/A | Metabolic alkalosis | Hypokalemia, hypocalcemia |
| Gastrointestinal | N/A | Paralytic ileus, constipation | Abdominal pain, diarrhea, constipation, anorexia |
An additional refeeding complication is Hyponatremia 2° hyperglycemia, which can result in: heart failure, arrhythmia, respiratory failure, pulmonary edema, renal failure, muscle cramps, fatigue, fluid retention, swelling/edema.
Risk factors for refeeding syndrome include:
- Suboptimal or no nutritional intake for > 5 days
- Postoperative
- Elderly with multiple comorbidities and decreased physiological reserve
- Cancer diagnosis
- Chronically malnourished: anorexia nervosa, chronic alcoholism, marasmus, prolonged fasting or low energy diet, morbid obesity with profound weight loss, malabsorptive syndrome (i.e. IBS, chronic pancreatitis, short bowel syndrome), high electrolyte losses (i.e. diarrhea, high output fistula, vomiting)
- Uncontrolled diabetes (i.e. electrolyte depletion, diuresis)
- Long term use of antacids
- Long term use of diuretics
- BMI <18.5
- Ongoing unintentional weight loss
Carson’s Risk of Refeeding Syndrome
Based on Carson’s clinical history and dietary information, he is at risk for refeeding syndrome.
Factors that increase Carson’s risk include:
- Suboptimal nutritional intake for > 5 days
- Ongoing weight loss (16.2% in 6 months)
- Underweight BMI (17.2 kg/m2)
- Postoperative
- Cancer diagnosis
On the 24-hour clock, 0600 hours is 6 AM. Conversely, 1800 hours is 6 PM.
Common medical abbreviation of Latin "quaque", meaning "each".
Common medical abbreviateion for Latin "hora somni", meaning "bedtime".
Common medical abbreviation for Latin "nil per os", meaning "nothing by mouth".
a bone at the top edge of the shoulder blade
The top of the pelvic bone, at the hip
The sacrum is a large triangular bone at the base of the spine, between the hip bones and above the tailbone.
Essential fatty acid
