
Module 3: Assessing Data Credibility
Ensure Your Comparisons Are Meaningful
Data visualization helps to compare information. You hear the term “apples to apples” comparisons. This means comparing data sets that are alike. Two sets of statistics that are being used to derive a comparison need to be meaningful comparators.
Common Descriptive Statistics
Browse through the list below for commonly used descriptive statistics:
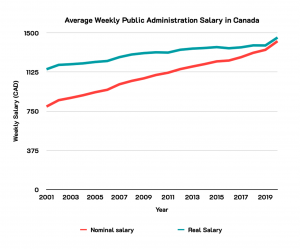
You may also need to adjust for time. For example, when looking at household income data from 1970 to 2021, you will need to adjust for inflation. [See the Bank of Canada’s Inflation Calculator.] Often, economists distinguish between nominal data (unadjusted) versus real data (adjusted over time). See Figure 3.1[1] for a line graph example of how nominal and real data differ.
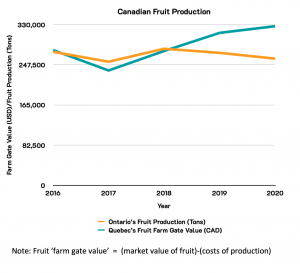
Check your knowledge using the line graph in Figure 3.2[2] with the activity that follows.
Avoid Confirmation Bias
When looking for data, we may be seeking to confirm what we already believe. While this may be human nature, it is important to find objective sources of data and let the analysis speak for itself. Reviewing good quality data can help to challenge our assumptions and ensure that we retain as much objectivity as possible.
- Statistics Canada. Table 14-10-0204-01 Average weekly earnings by industry, annual. Data is reproduced and distributed on an "as is" basis with the permission of Statistics Canada. Retrieved February 9th, 2022. DOI: https://doi.org/10.25318/1410020401-eng. Statistics Canada Open Licence: https://www.statcan.gc.ca/en/reference/licence ↵
- Statistics Canada. Table 32-10-0364-01 Area, production and farm gate value of marketed fruits. Data is reproduced and distributed on an "as is" basis with the permission of Statistics Canada. Retrieved January 9th, 2022. DOI: https://doi.org/10.25318/3210036401-eng. Statistics Canada Open Licence: https://www.statcan.gc.ca/en/reference/licence ↵
